Project Proposal
Data Visualization
Data visualization is an important tool in a world where huge amounts of data are generated daily. Trends or relationships, lost when viewing columns of thousands or millions of numbers, jump out with the appropriate graphical representation. For example, if you looked at the numbers measured for precipitation for September of this year, you probably would not notice what is obvious from Figure 1; areas from the Great Plains to the East Coast had above average precipitation while the West had below average precipitation. More climate maps can be found at https://www.climate.gov/maps-data.
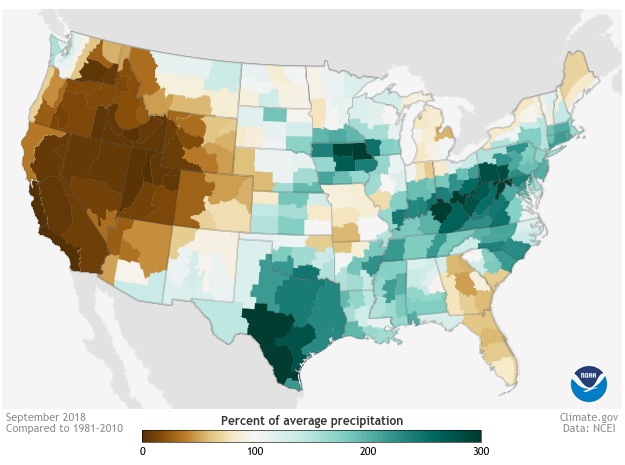
Figure 1. Precipitation for September, 2018, relative to the average precipitation for September over the past thirty years for each climate division.
Figure 2, a plot of daily maximum temperatures at the Washington National Airport for thirty years, clearly shows the fluctuation in temperature with season along with the spread of temperatures on any given day. The source of this figure along with a primer on climate is given at https://www.climate.gov/maps-data/primer/comparing-climate-and-weather
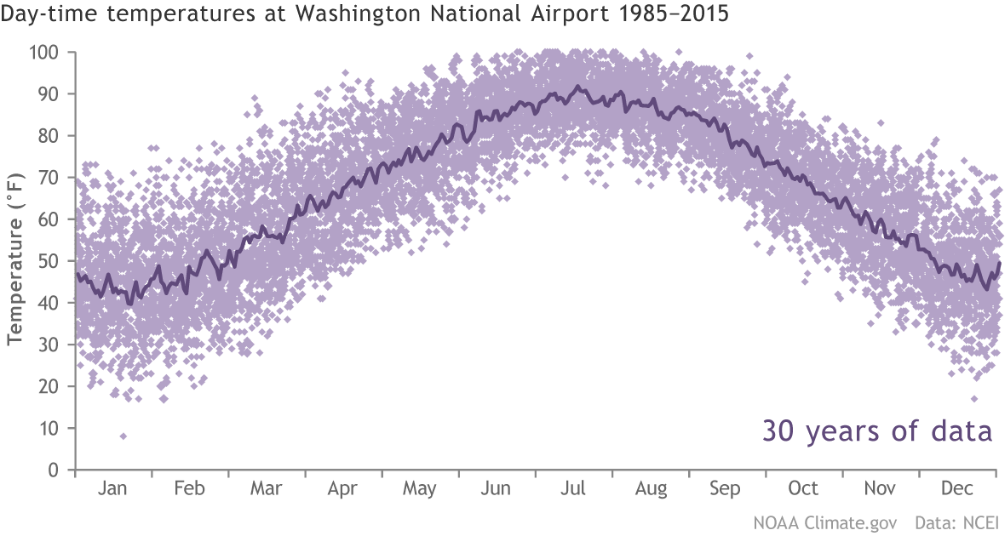
Figure 2. Maximum daily temperature at Washington National Airport for each day of the year over a thirty year span.
Final Project (This project is to be done individually.)
For the CSCI 203 final project, you will analyze weather data and present your results as a plot or graphic. This project will have two parts. For Part 1, you will analyze outdoor temperature measurements for New York City (Central Park), NY and present your results as graphs. For Part 2, you will pose a climate-related question, select the weather data and type of analysis to answer your question, analyze your dataset, and present the results of your analysis as a plot or graphic. For both parts, you need to use Python functions and incorporate techniques learned this semester.
Due Dates
- Project Proposal: Thursday, November 15, 2018
- Final Project: Sunday, December 2, 2018
Phase 1: Writing the Proposal
Before you write your proposal, you should read this entire document to understand the full scope of the project. Along with reading this document to understand the expectations for the final project and looking at https://www.climate.gov/ for ideas on available datasets and visualizations of climate data, you should also review the following:
- Look over the tutorial for Matplotlib that we have created for you
- Read instructions of how to install Matplotlib if you’d like to install the library on your own computer.
- Read the Programming Tips and Suggestions section of this document for some hints.
Part 1 of the Proposal
For your proposal, you should describe the functions that you will use in Part 1 to complete the required elements. Propose names for your Python functions and include docstrings describing what will be passed into the function and what will be returned if anything. While we explain Part 1 in significantly more detail lower in the document, below is a quick summary:
For Part 1, you will analyze temperature measurements for Central Park in New York City, New York at this link central_park.csv. Do the following:
- Determine the average of the daily temperature for each year (using the TAVG column) in the provided dataset and plot the average temperature as a function of the year. (See below for defining TAVG from the the TMAX and TMIN columns.)
- Determine the twenty years with the hottest average temperature and provide a graphical representation of your results using Matplotlib.
- Determine the number of days at or over ninety degrees for each year in the provided dataset.
- Determine the twenty years with the most days at or over ninety degrees and provide a graphical representation of your results using Matplotlib.
Part 2 of the Proposal
For Part 2 of the proposal, you will decide on an aspect of the climate that you would like to study, select an appropriate weather dataset, analyze the data with Python, and illustrate your results using Matplotlib. For inspiration, look through the datasets available from https://www.climate.gov/maps-data/datasets. After formulating a question about climate that you would like to answer, thoughtfully consider the steps needed to complete your analysis.
Communication is critical in computer science, as it is in any other major. You will be graded not only for having completed each portion of the proposal, but the overall quality of the proposal. More importantly, this proposal will allow us to give you feedback.
We encourage you to think ambitiously here. The amount of available weather data (temperature, precipitation, wind speed, etc.) is vast, and many questions could be asked based on it – Has the temperature in your hometown changed in the last 100 years? Are extreme temperatures occurring more often? Does it really rain more on the weekend than during the week? The idea is that you are using your new skills to investigate a question that is meaningful to you.
Part 2 Proposal Components
Your proposal for your selected area of investigation should be broken into the following sections:
- Overview and motivation of what you would like to analyze and why it is interesting.
- The dataset(s) that you will analyze including the type of weather data and the source of the data. They should align with the overarching question(s) you are planning to answer. Select open access datasets such as those at https://www.climate.gov/maps-data/datasets. Include a preliminary count of the number of measurements in your dataset. The total number of measurements should be at least 50K. If you cannot find 50K for one location, consider including more than one location in your study.
- How you will analyze it: There are many potential analyses of data such as determination of maximum values, minimum values, means, running averages, or variance. Your analysis for Part 2 should be significantly different from that done in Part 1. And like any good analysis, think of an interesting question first. Then, determine which kinds of analysis will help you answer that question
- Hand-drawn sketch with annotations of how you envision your data visualization. You will probably want to flip through existing plots on matplotlib to get a sense of what’s possible: http://matplotlib.org/gallery.html
- List of major functions that you will need for your project. This is where you must think through the logical components you would need to accomplish your analysis. What high-level functions might you need? We don’t expect you to get it perfectly, but this is intended to force you to think carefully about the complexity of your proposal. Show that you have thought through the problem. Write them as a function name, the information that needs to be passed into the function, followed by a docstring like description.
- Challenges that you may face in completing the project. What will involve the largest investment of time?
In total, the proposal should be about two pages single-spaced, and no more than three. It should have section titles and be clearly organized. It should be submitted as a PDF on Moodle.
Proposal Grading
The proposal is worth 20 points, distributed as follows:
- 10 pts: Completeness: Did you do everything that we asked you?
- 10 pts: Quality: Was your writing clear? Does your document look professional in quality? Is your document structured well?
While you should wait for an instructor’s feedback on your proposal before moving to programming Part 2, you can (and should) work on Part 1 well before that date.
Phase 2: Coding Your Project
For Phase 2 of your project, you will perform two different kinds of analyses. The first is to make sure you can nail down the basics. The second is an implementation and visualization of your own analysis.
Data visualization is a powerful mode of communication that is increasingly becoming a must-have tool for anyone who deals with data. Your brain is much better at interpreting visual representations of data than understanding pages of numbers. This allows people to digest enormous amounts of information in an instant, without laborious reading. To visualize information, we’ll be using Matplotlib – a 2D plotting library for Python. Be sure to go through the matplotlib tutorial that we have created for you.
Part 1: Climate Analysis and Visualization
For Part 1, you will analyze temperature measurements at this link taken over roughly 150 years in New York City (Central Park). Before you begin, scroll through the file to understand what values are given in each column in the file. It is always critical to understand your data before you program.
For climate_analysis.py
- You will create a dictionary yearly_av_temp where the keys are the years for which temperature was measured and the values are the average of the daily average temperatures for the year. You should have several helper functions. You will need to calculate the average temperature for each day in the data set. For this project, the average daily temperature will be the average of the maximum and minimum measured temperatures for the day.
- From your dictionary yearly_av_temp, you will determine the twenty years with the hottest averages of the average daily temperatures. When your program is run, the top 20 hottest years and the average daily temperature for those years should be displayed on the computer screen.
- You will also create a dictionary over_90_degrees where the keys are the years for which temperature was measured and the values are the number of days when the temperature was 90 degrees F or higher.
- From your dictionary over_90_degrees, you will determine the twenty years with the most days with measured temperatures of 90 degrees F or above.
You can check your code for producing dictionaries by analyzing the measurements in the linked file called LewisburgPA_2008_2017.csv. Note that only ten years of measurements are provided in the file. The first table shows the average of the daily average temperature for ten years ordered from highest temperature to lowest. The second table shows the number of days that the temperature was 90 degrees F or above for the year. This table is ordered from the most days at or above 90 degrees F to the least.

It is important that your program works exactly as described above. The program should automatically call a main() function when it is run. For example:
def main():
   print("There is where my code would go")

main()   # Begins running the code
For visualize.py
- You will present a plot or graphic visualizing the results that you found. There are a wide number of visualizations available. We suggest that you start with visualizing your data using basic plots to get you familiar with Matplotlib, then explore more advanced ways to visually represent your data. The data for your graphs should be a result of a call to your other functions. The data to be plotted should not be hard coded. Minimally, generate the following plots:
- Determine the average annual temperature for each year and provide a plot of these data. Whatever method you choose to visualize your data, there should only be one temperature represented for each year.
- Determine the number of days with temperatures >= 90 degrees F for each year in the provided dataset and provide a graphical representation of your results
- Determine the top 20 years that had the most number of days with temperatures >= 90 F, and provide a graphical representation of your results
- Your visualizations should be completed using Matplotlib.
- Similar to climate_analysis.py, there should be a main function
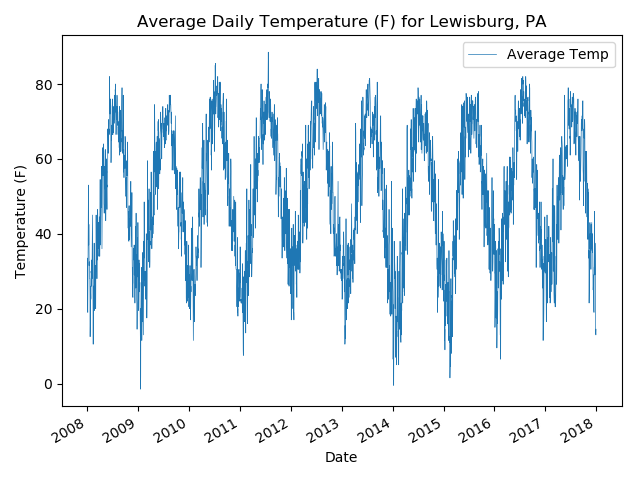
Below is one example of the average daily temperature plotted as a line graph for Lewisburg, PA between 2008 – 2017, plotted using Matplotlib. All of your plots should be labeled, with proper titles, and legends when appropriate.
Any csv files used in your analysis should be included along with your code that you submit in Moodle. Finally, think carefully about your code in this phase. You should be able to use (copy-paste) the components you build for this part, such as your function for reading data from a file, into the next one as well.
Scroll down to Programming Tips and Suggestions for some help on these points.
Part 2: Your Visualization and Analysis
You should complete your own analysis and data visualization (using matplotlib) that you described in your proposal. If at some point you find that your proposed analysis was too ambitious, it’s fine to change it. Simply explain the reason(s) in your README.txt at the end of the project. The analysis to answer the question that you proposed should include at least 50K measurements.
We encourage you to tackle an interesting question, not just an easy one! You will be graded partially on the creativity that you exhibit in your analysis. An analysis that requires very few changes from Part 1 will receive a lower grade than one that requires more significant changes.
This is a complex task, and will differ for different individuals, so before you get started make sure to take a good look at the feedback you get from instructors on the project proposal, and think carefully about the structure of your program.
Similar to Part 1, the program should automatically call the main() function when it is run without forcing the user to type the function name in the Python shell prompt. See the given Python files for an example.
Phase 2: What you turn in
For this phase, you will submit the following on Moodle:
climate_analysis.py: a Python program that prints:- the years and the temperatures corresponding to the 20 years with the hottest average of the average daily temperatures and
- the year and the number of 90 degree F or hotter days for the 20 year with the most 90 degree F or days.
visualizeText.py: a Python program that creates a data visualization based on climate_analysis.py.(Note: You will likely need to use functions developed inclimate_analysis.py. We’d suggest you copy these functions into the filevisualizeText.py.)phase2.py: a Python program that contains *your* analysis and visualization that you proposed. This is the most significant portion of the project! Don’t put this off!- a
README.txt: a text file that- gives clear instructions about how to run your analysis (it might be short!);
- explains what does or doesn’t work in your project;
- includes a 1-paragraph reflection about your experience with the project.
- includes a 1-paragraph reflection on what you learned from the results of your analyses. (Did you learn anything about climate or data analysis?)
- Any data files used by the program, e.g.,
central_park.csv. - A screenshot (or screenshots) of what your visualization(s) look like when you run them on your computer. This helps provides us context for what you think is working, even if it doesn’t work on our computers for some reason.
Submit all of your files to Moodle.
What you will be graded on
- 8 pts: How the organization of your program’s functions separates the tasks into a manner that is easy to understand and follow.
- 8 pts: Use of good programming style, as defined by our programming style guidelines.
- 8 pts: Use of doctests for each function that you write.
- 6 pts: Correct submission, including the README and all necessary data files to run the program.
- 40 pts: The functionality of the two programs. Do they work as specified? Any run time errors?
- 10 pts: Creativity in choice of analysis and design of the visualization.
Programming Tips and Suggestions
Reading in text file(s)
The files provided for you on this page and many of the data sets on www.climate.gov are csv (comma-separated-values) files. The following code can be used to read the linked file titled LewisburgPA_2008_2017 that includes six columns of data: measurement station identification, location (Lewisburg, PA), date of measurement, maximum measured temperature for the day, minimum measured temperature for the day, and the temperature at the time of recording of the measurements. The columns with indices 2, 3 and 4 correspond to date, maximum measured temperature, and minimum measured temperature.
import csv

def readDataFile(filename):
    '''
    Function to read a csv file and store the data in a list
    Input filename is a string
    Return dataList, a list with values from the
    columns with index 2, 3, and 4 from the file with name of filename
    '''
    dataList = []                                  # initialize list for storing values
    with open(filename, newline='') as csvfile:    # creates a file object
       csvreader = csv.reader(csvfile, delimiter=',') # set for reading csv file
       for row in csvreader:                          # reads one row at a time
         dataList += [[row[2], row[3], row[4]]]         # saving columns with index of 2, 3, and 4
    return dataList                                # return a 2-D array with 3 columns
Note that the values in the returned 2-D array called dataList will all be strings. You will need to slice and/or convert them depending on what you need to do.
A Dictionary with an Order?
Dictionaries can be very handy for your project. For example, imagine that you created a dictionary called d with keys that are the years for which you have temperature measurements and the values are the temperatures measured for a given year. You could use this dictionary to make a new dictionary counting the number of days in a given year that the maximum temperature for the day was equal to or above ninety degrees F. This code should look somewhat familiar from the Python dictionary that we made in class.
# Assume 'd' is a Python dictionary with keys equal to the year that temperatures were measured
# and the temperature measurements for a year as the values
# new_d, a dictionary with the same keys as d but the values are the number of
# days that the maximum temperature for that year was above 90 degrees F.
#
new_d={}                    # Initialize the new dictionary
for year in d:              # Accesses the keys from the original dictionary
    new_d[year]=0           # Sets the value for a given key to zero
    for t_max in d[year]:   # Loop to go through all the temperature values in d
        if t_max >=90:      # Checks if any values are equal or greater than 90 degrees
            new_d[year]+=1  # If so, value for that year is incremented
However a Python dictionary does not keep keys and values in their natural order. For example, the key/value pair {'apple': 10} is not necessarily listed before {'orange': 5}. But for our project, you would find it handy to have the dictionary created in the last example to be ordered in descending order of days at or above ninety degrees. You will need to use the Python OrderedDict, or ordered dictionary for a sorted dictionary. Here is a simple example of how a Python ordered dictionary works.
>>> from collections import OrderedDict
>>> new_d
{2008: 15, 2009: 3, 2010: 24, 2011: 11, 2012: 15, 2013: 9, 2014: 0, 2015: 1, 2016: 15, 2017: 4}
>>> ord_by_keys = OrderedDict(sorted(new_d.items(), key = lambda t: t[0], reverse = True))
>>> ord_by_keys
OrderedDict([(2017, 4), (2016, 15), (2015, 1), (2014, 0), (2013, 9), (2012, 15), (2011, 11), (2010, 24), (2009, 3), (2008, 15)])
>>> ord_by_values = OrderedDict(sorted(new_d.items(), key = lambda t: t[1], reverse = True))
>>> ord_by_values
OrderedDict([(2010, 24), (2008, 15), (2012, 15), (2016, 15), (2011, 11), (2013, 9), (2017, 4), (2009, 3), (2015, 1), (2014, 0)])
Notice that the dictionary new_d is not ordered. However, ord_by_keys is ordered by keys through use of t[0] in the code and ord_by_values is ordered by values through use of t[1] in the code. Whether the values are ascending or descending is determined by the reverse parameter with True for descending and False for ascending.
Column headers or missing data?
Your code needs to be able to handle column headers and missing measurements. A missing measurement may show up in you downloaded data as an empty string. For the two csv files provided on this page, the first row has titles for the columns. Here is some code that you can use to calculate the average of the columns with indices 1 and 2.
# Assume datalist  is a 2-D array with 3 columns
    for i in range(1,len(dataList)):
        if dataList[i][1] =='' or dataList[i][2]=='':
            continue
        else:
            av = (int(dataList[i][1])+int(dataList[i][2]))/2
Writing Good Code.
Your project will be judged on not only whether you code works, but also whether you wrote good code. Refer to Python Style Requirements on the home page for general information, but here are the main points:
- Make sure that each of your Python functions encapsulates one particular defined task. A function shouldn’t do too much at once. If one of your functions ends up with many lines of code, that is probably a good sign that you should split it up into different functions.
- Each function should have a docstring
- Each function should have tests in the docstring (much like we’ve been doing in lab). When a doctest is inappropriate (for example, it involves graphical output), you may describe how you tested it in a sentence or two. If you write doctests as you go (instead of at the end), it should save you an enormous amount of time.
- Avoid magic numbers and global variables!
- Use descriptive function and variable names. A function name like
printBoardis more descriptive thanpb. A variable name likecolorsornumColorsis more descriptive thancorx. - Don’t repeat yourself. If you have the same code more than once, it probably means that you should move that code into a function and then call it from wherever you need it.
- Comments should be used for any code that isn’t obvious.