Homework Set 4
Problem 1

Problem 1 data: fit_1.dat
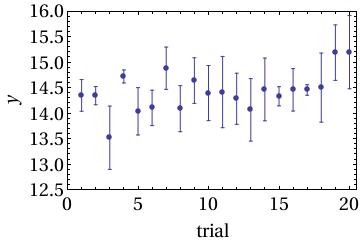
This data comes from twenty experiments nominally measuring the same physical quantity. The data for each point is on a single line in the file. The first number on each line is the value of the measured quantity, and the second is the uncertainty in the this measurement. Use these data to answer the following questions.
- What value do you quote for this quantity based on the data? (Include an uncertainty.)
- Each data point has its own uncertainty \(\sigma_i\). How many of the data points lie within \(1\sigma_i\) of the mean value you determined?
- What is the goodness-of-fit parameter \(\chi^2\) for this data set and model? (Note: In this case, the function \(y(x)\) is just the constant value of the mean you determined.)
Problem 2

Problem 2 data: fit_2.dat
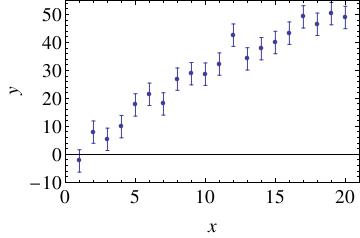
Data for an experiment in which there is a suspected linear relationship between measured values of \(x\) and \(y\). The data for each point is on a single line in the file. The first number on each line is the value of \(x\), the second is the value of \(y\), and the third is the uncertainty in the measured value of \(y\). Uncertainties in \(x\) are assumed to be negligible. Use these data to do the following:
- Perform a fit to these data using the generic
optimize.curve_fitroutine fromscipythat we demonstrated in class. - Plot your normalized residuals. How many of the data points lie within \(1\alpha\) of the line you determined?
- Determine the goodness-of-fit parameter \(\chi^2\) for this data set and model.
- Given your analysis, does a linear fit to the data appear to be reasonable? Comment briefly.
- What value do you quote for the slope and intercept based on the data? (Include uncertainties.)
Problem 3

Problem 3 data: fit_3.dat
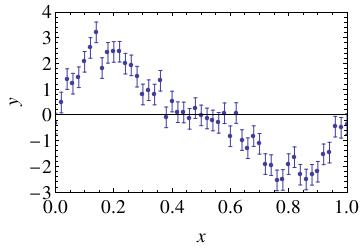
For the data in this set, there is reason to believe that that \(x\) and \(y\) are related by a function of the form \(y = a_1 \sin(2\pi x) + a_2\sin(4\pi x)\). The data for each point is on a single line in the file. The first number on each line is the value of \(x\), the second is the value of \(y\), and the third is the uncertainty in \(y\). Uncertainties in \(x\) are assumed to be negligible.
- Is the suspected relationship between \(x\) and \(y\) a linear model, or a nonlinear model?
- Perform a fit to these data using the generic
optimize.curve_fitroutine fromscipythat we demonstrated in class, using the assumed functional form shown above. - Plot your residuals.
- Determine the goodness-of-fit parameter \(\chi^2\) for this data set and model.
- Given your analysis, does your fit to the data appear to be reasonable? Comment briefly.
- What are your resultant values for \(a_1\) and \(a_2\)? (Include uncertainties.)