
Basically, we want to characterize the "footprint" of kidneys in CT
images. This may
help us to better predict and determine where the kidney in a particular
image is.
We have kidney models that fit images of the kidney. Puting a
model in an image, we can
pick up intensities along the normal to the surface at many points,
and analyze what we see.
The intensity samples along a normal at a point are called an intensity
profile (the left figure
at bottom show a number of profiles on a kidney surface).
Over many kidney cases, the intensity profiles are acquired at corresponding
points. Any
number of statistical analyses can be performed on the data that lead
to scalar fields that
we would like to map on to the kidney surface model.
We are interested in a tool that would interactively allow the display
of such scalar fields
on the kidney surfaces.
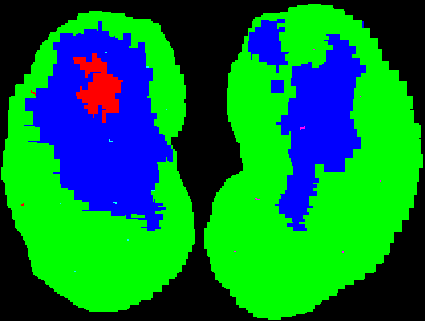
The example on the right bellow is as follows: If we normalize all of
the data and perform
a k-means clustering, three classes of profile come up. We grade the
profiles at a point
over all cases and assign a color to that point according to which
cluster mean it graded
best against over all cases. The example is a right kidney and
there is physical intuition
for the result, which is a positive (basically, the profiles in the
blue and red areas are
in the non-green cluster due to the nearby and bright liver).

